
Demand Planning
From past sales to a reliable demand plan: cleanse, segment, forecast, agree.
Demand Planning first cleanses the sales history (missing periods, stock-outs, promotions, outliers), classifies items with ABC-XYZ and, for every item, selects the best model from an 11-model pool by backtesting. Sales, marketing and finance inputs are kept in separate columns; the approved version feeds S&OP and the capacity plan.
What you gain with OPLAN
- Demand is held by item × customer × location; an aggregate-forecast-disaggregate policy can be chosen at family level.
- AI explains model choices and data-quality findings, reviews overrides and drafts scenario summaries; it does not decide.
How it works
From history to an approved demand plan in four steps.
-
1
Cleanse the history
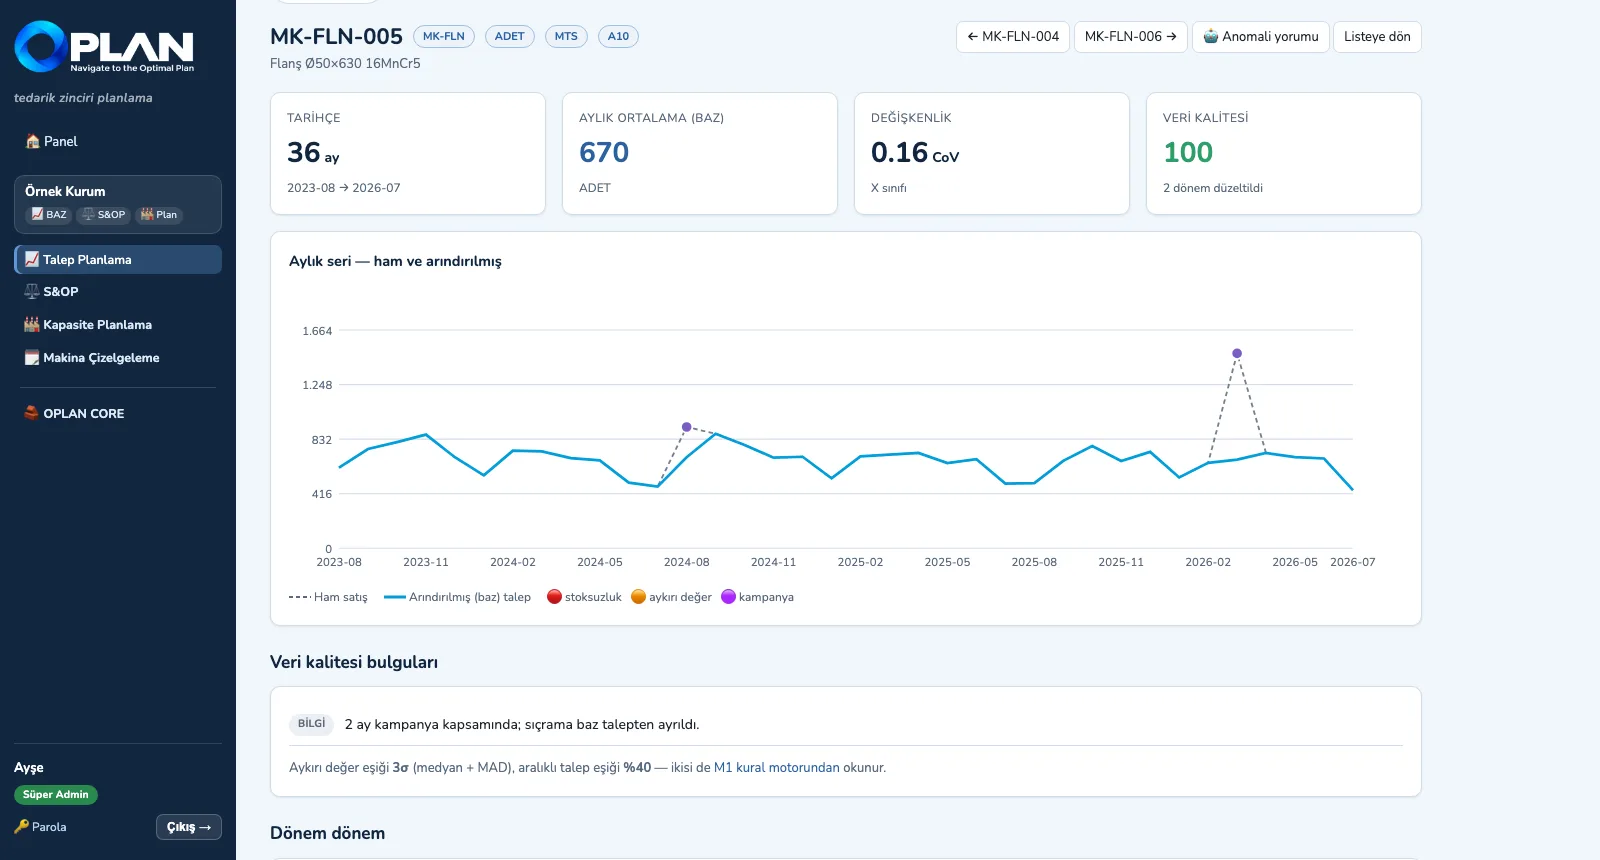
Raw sales and cleansed (base) demand on one chart; promotions, stock-outs and outliers are marked, and the reason for every correction is listed period by period.
-
2
Segment the items
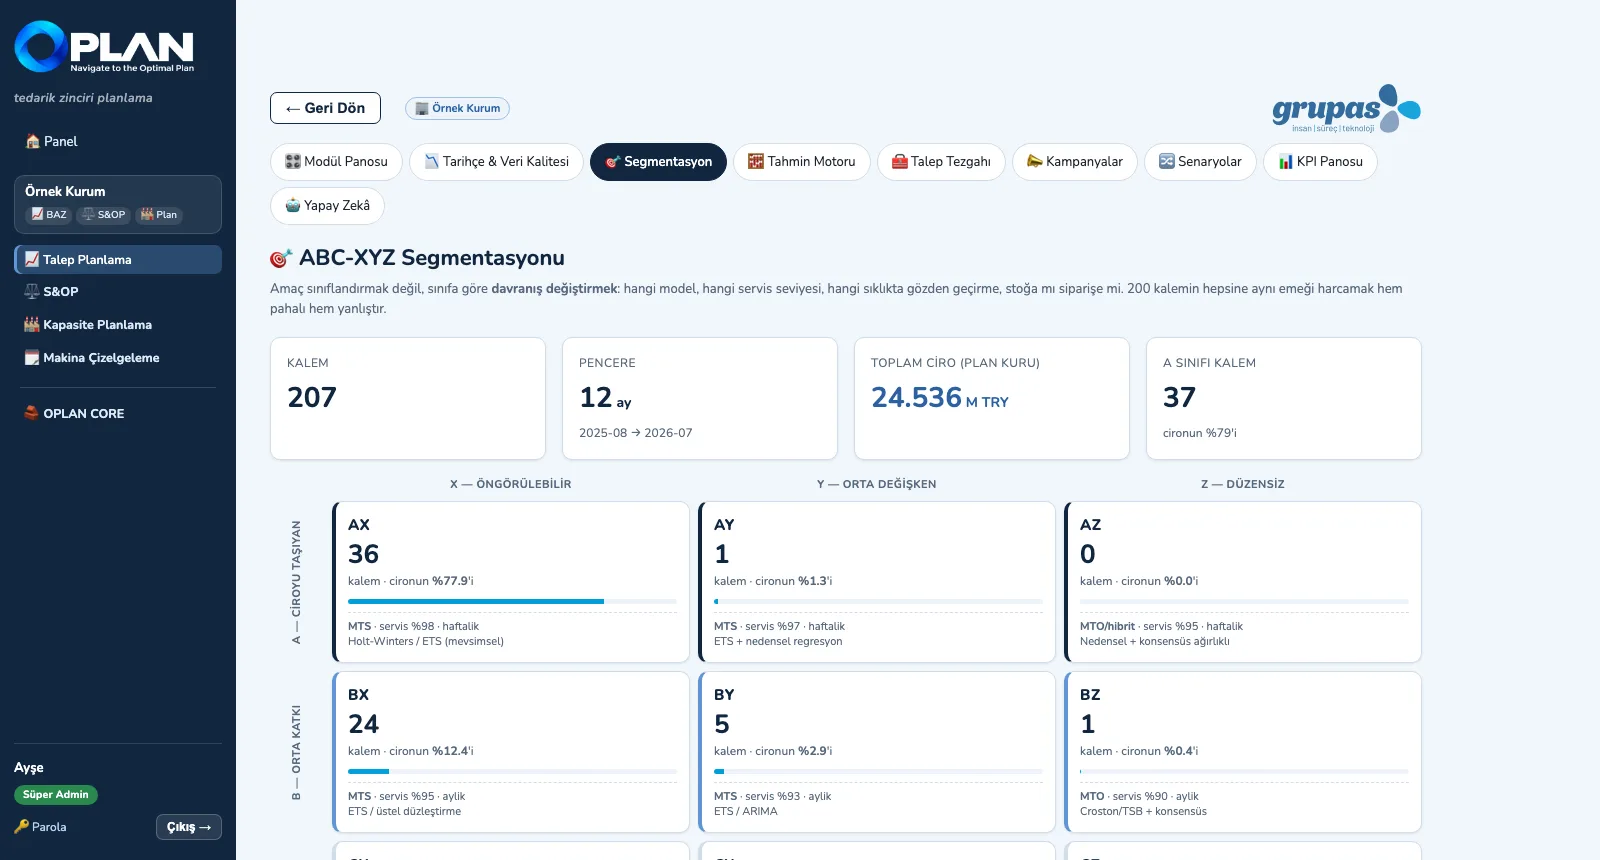
ABC by revenue contribution, XYZ by variability; each of the nine boxes carries its own model, service level and review policy.
-
3
Generate the forecast
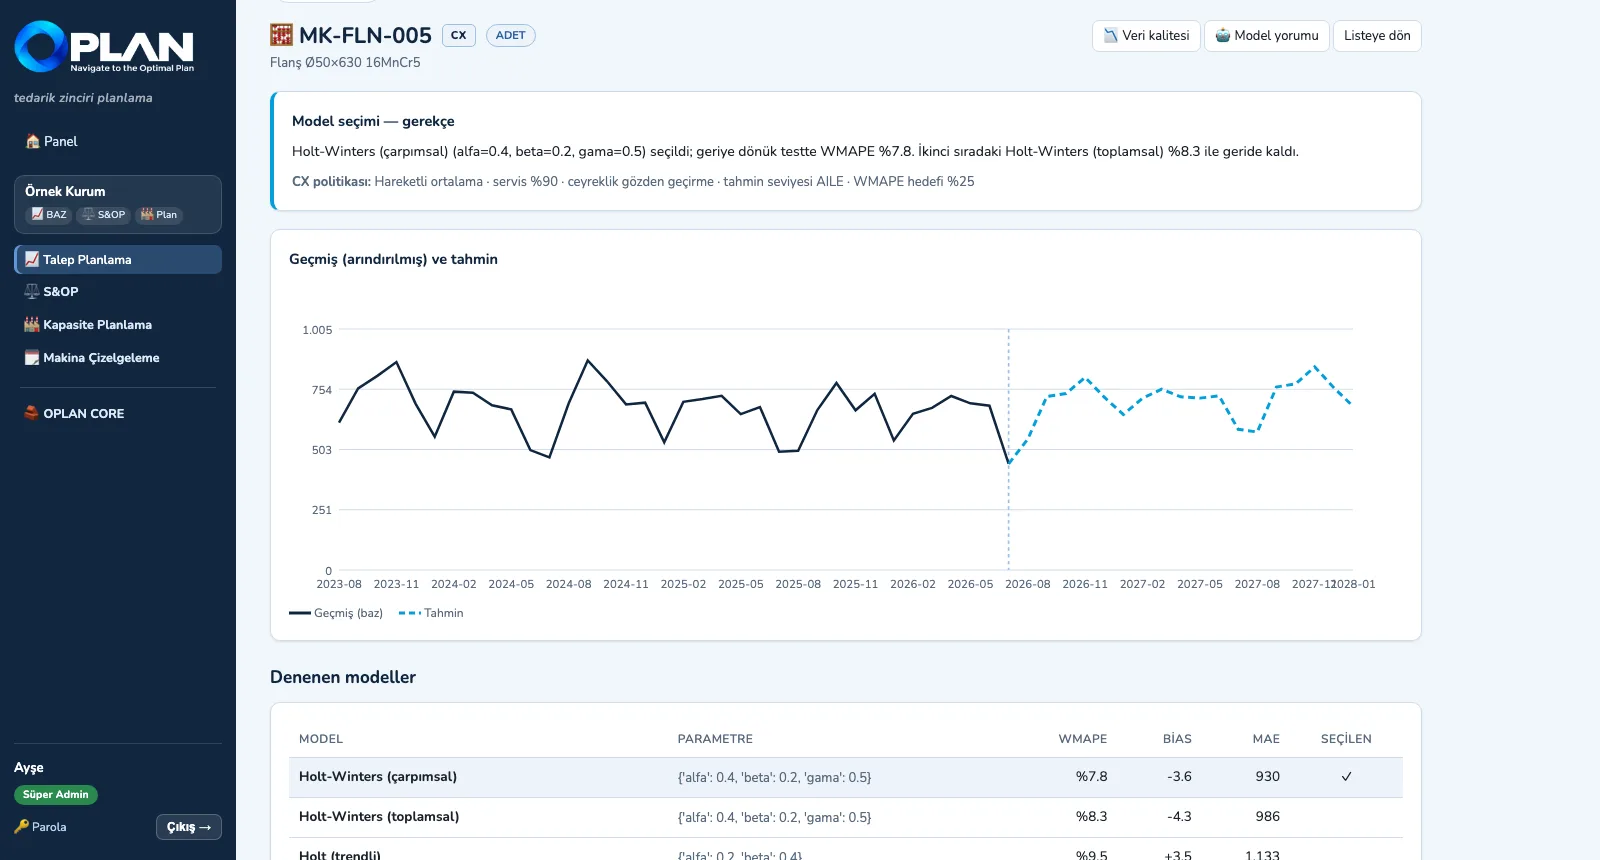
The engine backtests the models for every item, picks the one with the lowest WMAPE and writes down why; every model tried is in the table.
-
4
Agree and approve
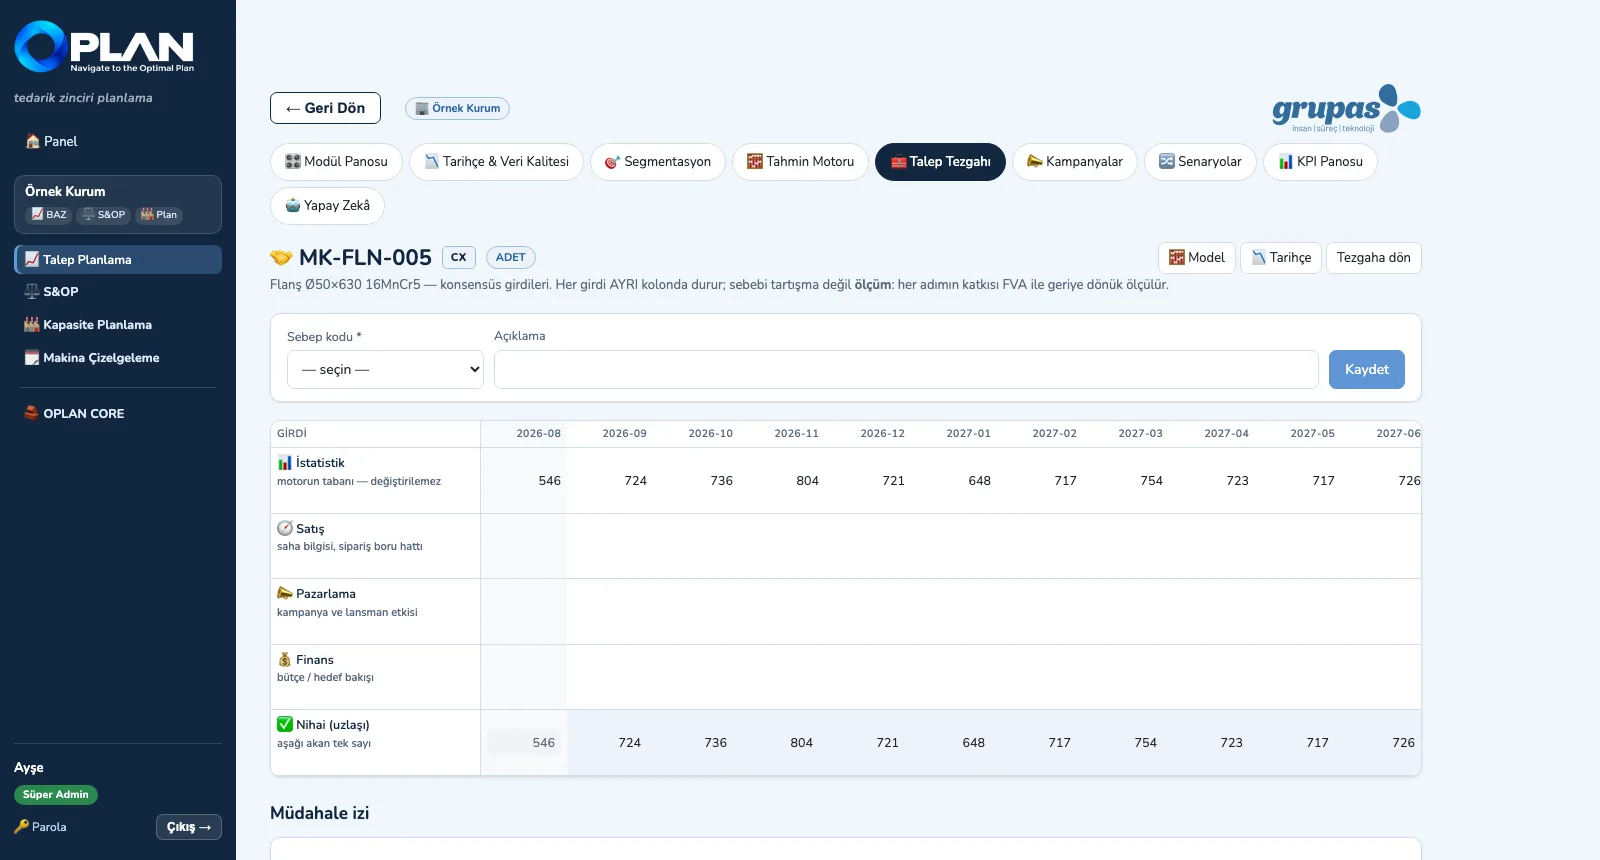
Sales, marketing and finance enter their inputs in their own columns; the final figure changes with a reason code and, once the version is approved, moves on to S&OP.
Screens are shown with sample plant data; the application interface is in Turkish.
Purpose
To produce one agreed demand plan and, by measuring each step's contribution to accuracy, turn planning into a self-correcting process.
Features
- Sales history and data quality: missing periods, stock-out add-back, promotion cleansing, median + MAD outliers, working-day normalization — raw and cleansed series chart per item
- ABC-XYZ segmentation: 9 boxes, each carrying a model family, service level, review frequency and MTS / MTO policy
- 11-model forecasting engine (naive, moving averages, exponential smoothing, Holt, Holt-Winters, Croston, TSB …): backtesting, automatic selection by WMAPE with its rationale
- Demand workbench: period × item grid, statistical / sales / marketing / finance / final columns, reason-coded overrides, full audit trail, frozen horizon and override limit, version approval
- Promotion lift measurement, price elasticity and demand shaping; a lever-based scenario manager and hand-over of the approved scenario to S&OP
- KPI dashboard: WMAPE, bias, tracking signal, FVA (naive → statistical → final) and plan stability
Benefits
- The forecast does not learn from promotion spikes or stock-out dips
- Why each item's model was chosen is shown on screen
- The contribution of manual overrides is measured with FVA
Who uses it
Demand planners, sales and marketing teams, finance and planning managers.